Real-time tracking of household data.
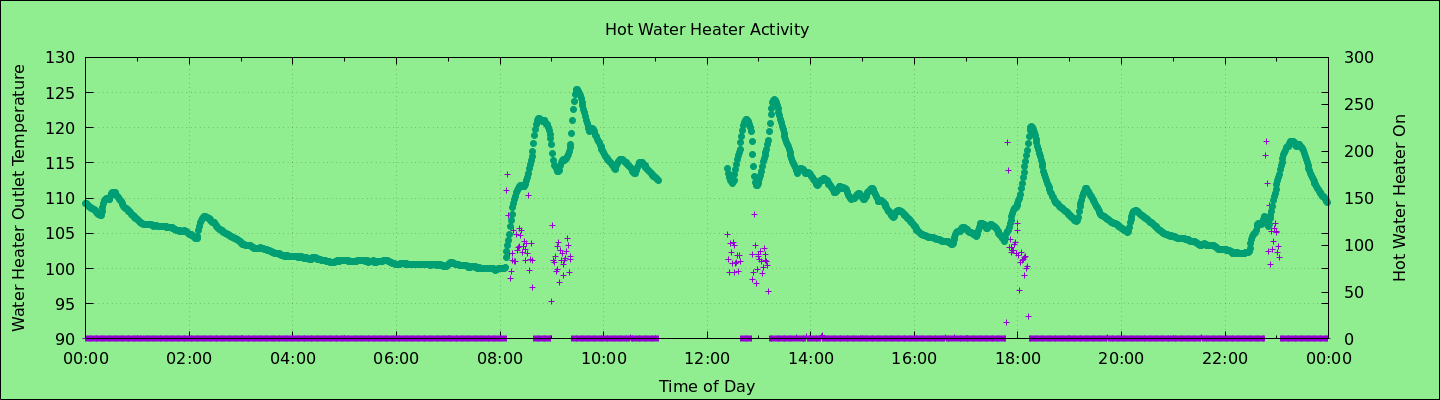
Vibrations indicate when the water heater exhaust fan is running. With seven showers, and three or four hot water wash loads a day, this isn’t bad. When the water heater is heating, the plot turns red, letting everyone know the water isn’t ready. We’re also tracking temperature of the water heater outlet coupling in the hope that we will discover some less conservative logic for ensuring hot water.
An ultrasonic distance sensor estimates how far the surface of the sump water is from the cellar floor. Too close to the floor and it sends a text message. We were surprised by a text message one morning. It turned out that a fountain-like leak had formed in the sump plumbing and soaked the sensor circuit. It would have been a problem in the finished basement – so we count this as a win!

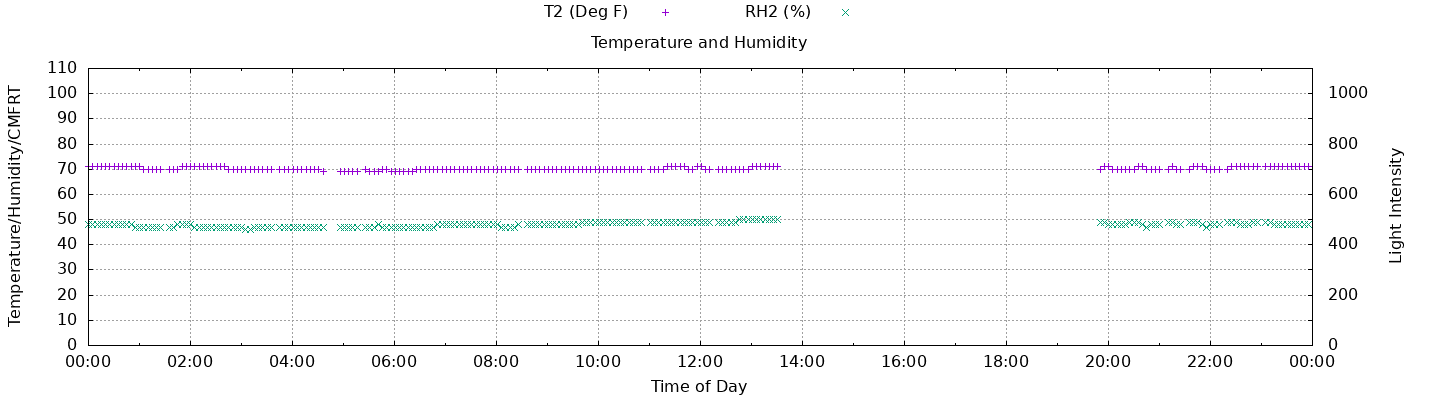
Temperature and humidity data taken with an Arduino are sent wirelessly to a Raspberry Pi thermostat / humidistat to control the comfort level of the basement living area. On occasion, some similar sensing units are left outdoors to help us understand the micro-climates in the gardens.
Below is a sample of the vibration frequency spectrum of our dryer.
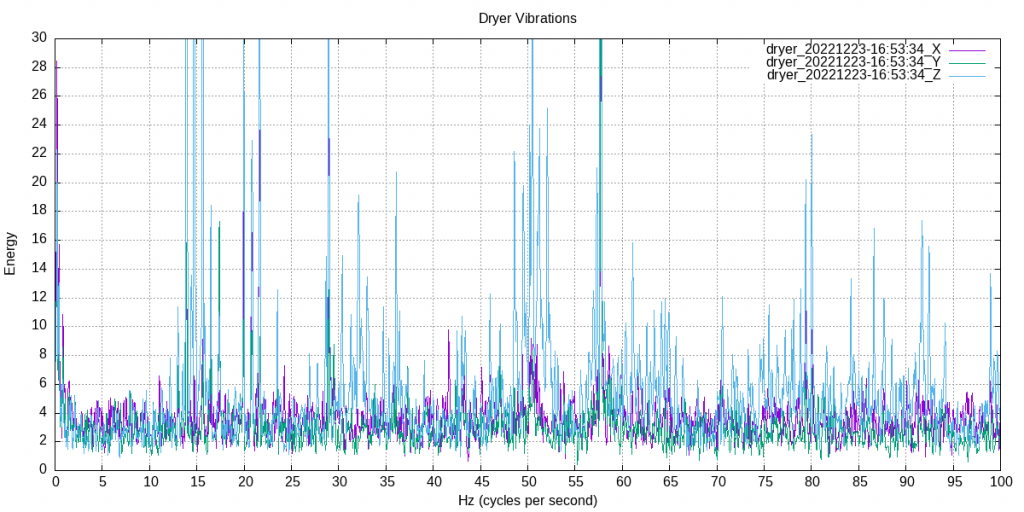
Computing the principal components across multiple instances of the frequency spectrum will supply dimensions that track variables like the mass of the dryer load, the temperature of the dryer load, and the mass of objects sitting on the dryer during test. At one point the mass of the dryer loads appeared to be going up steadily over the course of a week. I checked the analytics over and over trying to find the problem, only to be surprised when the washer spin cycle failed. Here is an example plot of the principal component representing the mass in the dryer.
We added a moisture sensor to the joint at the base of the main house drain stack where it joins with the iron pipe that travels under the cellar slab. The joint will seep if the waste water flow backs up above the level of the joint. At that point we get emails and text messages.
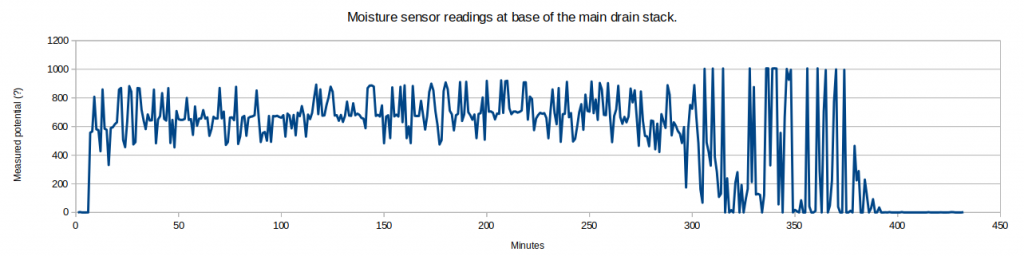
This is hopefully a boring plot that stays at zero (no moisture) for years at a time. What we see above is what happens when I put a few drops of water in the joint. You can see it took about 400 minutes to dry to the point where the sensed moisture level goes back to zero.